MARCH 2008
LINCOLN, NE

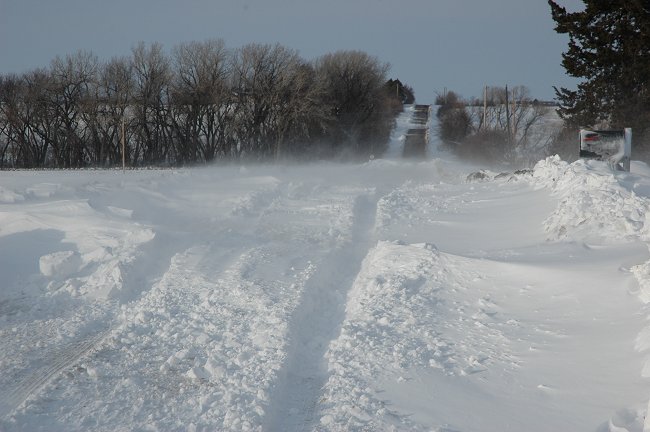
New:NOAA Reports, Coldest Winter Since 2001 (March 15, 2008)
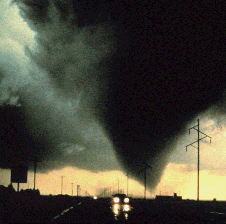
New: Study Reports Wheat Fields Fuel Tornadoes (March 17, 2008)
New:  Year 2007 Nebraska Tornadoes (March 15, 2008)
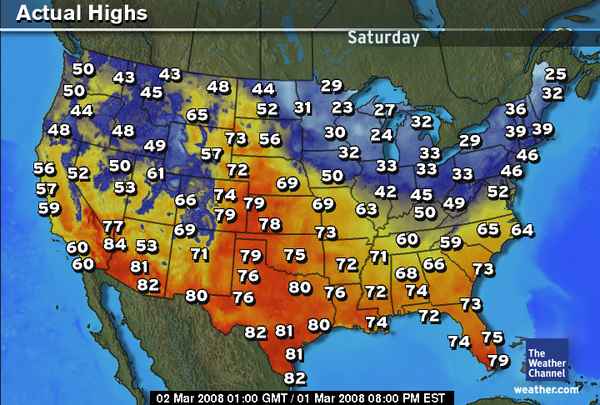
Recently New: Winter 2007-08 U.S. Forecast  vs. Observed Temperatures and Precipitation
 Daylight Savings Time  
and Season Starting Dates
February 2008 Temperature Graph (Compared to Normals)
March 1, 2007 - February 29, 2008 Temperature Graph Compared to Normals
Winter 2007-08 Climate Summary
Lincoln Winter Temperature Averages 1887-88 through 2007-08
Lincoln Winter Temperature Averages RANKED 1887-88 through 2007-08

Lincoln
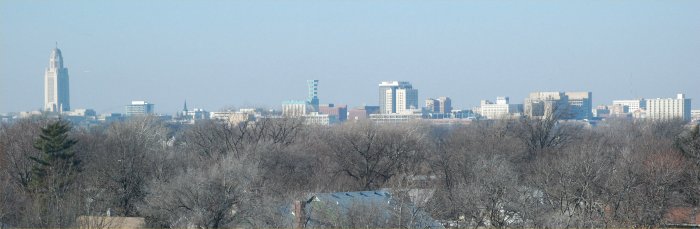
March 7, 2008: A close-up view of the skyline of Lincoln, NE, as seen from Hardin Hall, home of this web site.  

Also see our new photo gallery

 Lincoln Live Weather Watching Web Cams

NEW:  Lincoln Cold Waves 

Saturday, March 29, 2008.
Central Plains Severe Weather Symposium
and Family Weatherfest. 

Event Website:  Click Here

Lincoln, NE, Monthly Snowfall 2007-08

Month
Oct.
Nov.
Dec.
Jan.
Feb.
Mar.
Apr.
TOTAL
Observed
0.0
0.4
8.9
4.9
5.1
1.1  
20.4
Normal
0.7
3.1
5.4
6.1
5.4
5.1
1.7
27.5

Year 2008 Precipitation (in inches)
compared to normal: red above normal, blue below normal

JAN
FEB
MAR
APR
MAY
JUN
JUL
AUG
SEP
OCT
NOV
DEC
TOTAL
2008
0.44
0.55
0.31
  - - -
.
.
.
.
.
1.30
NORMAL
0.67
0.66
2.21
2.90
4.23
3.51
3.54
3.35
2.92
1.94
1.58
0.86
28.37
(normal January 1 - March  31 = 3.54 inches)
  
March 2008
MAX
MIN
MEAN
DEP
PREC
REC
PREC
REC
MAX
REC
MIN
HDD
CDD
Norm
MAX
Norm
MIN
Norm
Mean
SNOW
Saturday 03/01/08
69 32 51 +18 0.00
0.62
81
-6
14 0
45
22
33
 
Sunday 03/02/08
60 34 47 +13 0.11
0.55
79
-7
18 0
45
22
34
0.1
Monday 03/03/08
34 19 27 -7 0.00
0.92
78
-10
38 0
46
23
34
 
Tuesday 03/04/08
41 15 28 -7 0.00
0.88
80
-19
37 0
46
23
35
 
Wednesday 03/05/08
36 19 28 -17 0.00
1.16
74
-7
37 0
46
23
35
 
Thursday 03/06/08
44 14 29 -6 0.04
0.58
80
-11
36 0
47
24
35
 1.0
Friday 03/07/08
27 1 14 -22 T
0.87
74
-9
51 0
47
24
36
Saturday 03/08/08
45 5 25 -11 0.00
0.80
79
-8
40 0
48
25
36
 
Sunday 03/09/08 43 18 31 -6 0.00 0.57 82 -2 34 0 48 25 37   
Monday 03/10/08
49 14 32 -5 0.00
0.87
76
-7
35 0
49
25
37
 
Tuesday 03/11/08 71 29 50 +13 0.00 0.73 84 -19 15 0 49 26 37  
Wednesday 03/12/08
67 27 47 +9 0.00
1.11
81
-15
18 0
49
26
38
 
Thursday 03/13/08
64 27 46 +8 0.00
0.68
80
-5
19 0
50
26
38
 
Friday 03/14/08
54 30 42 +3 0.00
0.86
82
-5
23 0
50
27
39
 
Saturday 03/15/08
43 24 34 -5 0.01
0.88
85
-1
31
0
51
27
39
 
Sunday 03/16/08
40 17 29 -10 0.01
1.29
81
-4
36 0
51
27
39
 
Monday 03/17/08
42 36 39 -1 0.14
1.09
84
-5
26 0
52
28
40
 
Tuesday 03/18/08
58 25 42 +2 0.00
1.80
87
-7
23 0
52
28
40
 
Wednesday 03/19/08
61 22 42 +1 0.01
1.28
82
-3
23 0
53
29
41
 
Thursday 03/20/08
68 26 47 +6 0.00
0.75
79
-3
18 0
53
29
41
 
Friday 03/21/08
56 32 44 +3 0.00
0.42
88
5
21 0
53
29
41
 
Saturday 03/22/08
45 30 38 -4 T
1.75
90
6
27 0
54
30
42
 
Sunday 03/23/08
45 21 33 -9 0.00
1.41
88
7 32 0
54
30
42
 
Monday 03/24/08
          
1.64
83
7
   
55
30
43
 
Tuesday 03/25/08
          
1.96
91
5
   
55
31
43
 
Wednesday 03/26/08
          
1.21
88
2
   
55
31
43
 
Thursday 03/27/08
          
0.98
84
6
   
56
32
44
 
Friday 03/28/08
          
1.74
90
11
   
56
32
44
 
Saturday 03/29/08
          
1.34
89
12
   
57
32
45
 
Sunday 03/30/08
          
0.99
88
10
   
57
33
45
 
Monday 03/31/08
          
1.73
88
14
   
58
33
45
 
TOTAL


0.31  


1.1
AVERAGE


NORMAL
51.2
27.5
39.4
 
2.21


 799
1


5.1
DEPARTURE


LAST YEAR:  A rural Lancaster County road following the March 1, 2007 Storm.
March 1, 2007:  Snowstorm and Blizzard in Eastern Nebraska.


A rural Lancaster County road following the March 1, 2007 Storm.
March 1, 2007:  Snowstorm and Blizzard in Eastern Nebraska

 
From the climate record books:
Warmest recorded MARCH  temperature, 91 F, March 25, 1972.
Coldest recorded MARCH  temperature, -19 F,  Mar. 4, 1978 and Mar. 11, 1907.
Most MARCH Snowfall: 21.3 inches, 1912.
Least MARCH Snowfall: none measurable, 13 of the last 107 years.

AVERAGE AND TOTAL are MARCH 2008.
NORMAL (Norm) is the 1971-2000 Standard Normals in deg. F.
DEPARTURE is MARCH 2008 Average measured against 1971-2000 normals, in deg. F.
MAX = Observed Maximum and MIN = Observed Minimum temperatures in deg. F.
MEAN = Observed Mean Daily temperature in deg. F.
DEP = Departure from normal ( __ = below normal, + above normal), in deg. F.
PREC = Observed daily precipitation (midnight to midnight, CST) in inches.
REC PREC = Record daily amount of precipitation in inches.
REC MAX = Record maximum temperature in deg. F.
REC MIN = Record Minimum temperature in deg. F.
HDD = heating degree day units (base of 65 degrees) in deg. F.
CDD = cooling degree day units (base of 65 degrees).
Norm MAX = Daily Normal High Temperature (1971-2000 normals) in deg. F.
Norm MIN = Daily Normal Low Temperature (1971-2000 normals) in deg. F.
Norm Mean = Daily Normal Mean Temperature (1971-2000 normals) in deg. F.